Die Grafik zeigt die prognostizierten Quartalsgewinne (Bereinigter Gewinn pro Aktie, EPS) und die tatsächlich erzielten Gewinne (grün: Analystenschätzungen übertroffen, rot: Analystenschätzungen verfehlt) für den ausgewählten Zeitraum.
Umsatz (USD)
Schätzung
Umsatz
Die Grafik zeigt die prognostizierten Quartalsumsätze und die tatsächlich erzielten Umsätze (grün: Analystenschätzungen übertroffen, rot: Analystenschätzungen verfehlt) für den ausgewählten Zeitraum.
Güte der Analystenschätzungen – EPS (aktueller Zeitraum)
Quartal / Datum
EPS (USD)
Schätzung (USD)
Abweichung
Quartal / Datum
Umsatz (Mio USD)
Schätzung (Mio USD)
Abweichung
Revisionen der Gewinnschätzungen
EPS-Schätzungen für die Geschäftsjahre
2026, 2027, 2028.
StoneCo Ltd. (NASDAQ: STNE - Get Free Report) was the recipient of unusually large options trading activity on Monday. Stock investors purchased 9,352 call options on the company. This represents an increase of 329% compared to the typical volume of 2,180 call options. StoneCo Stock Performance Shares of NASDAQ STNE traded up $2.38 during trading hours
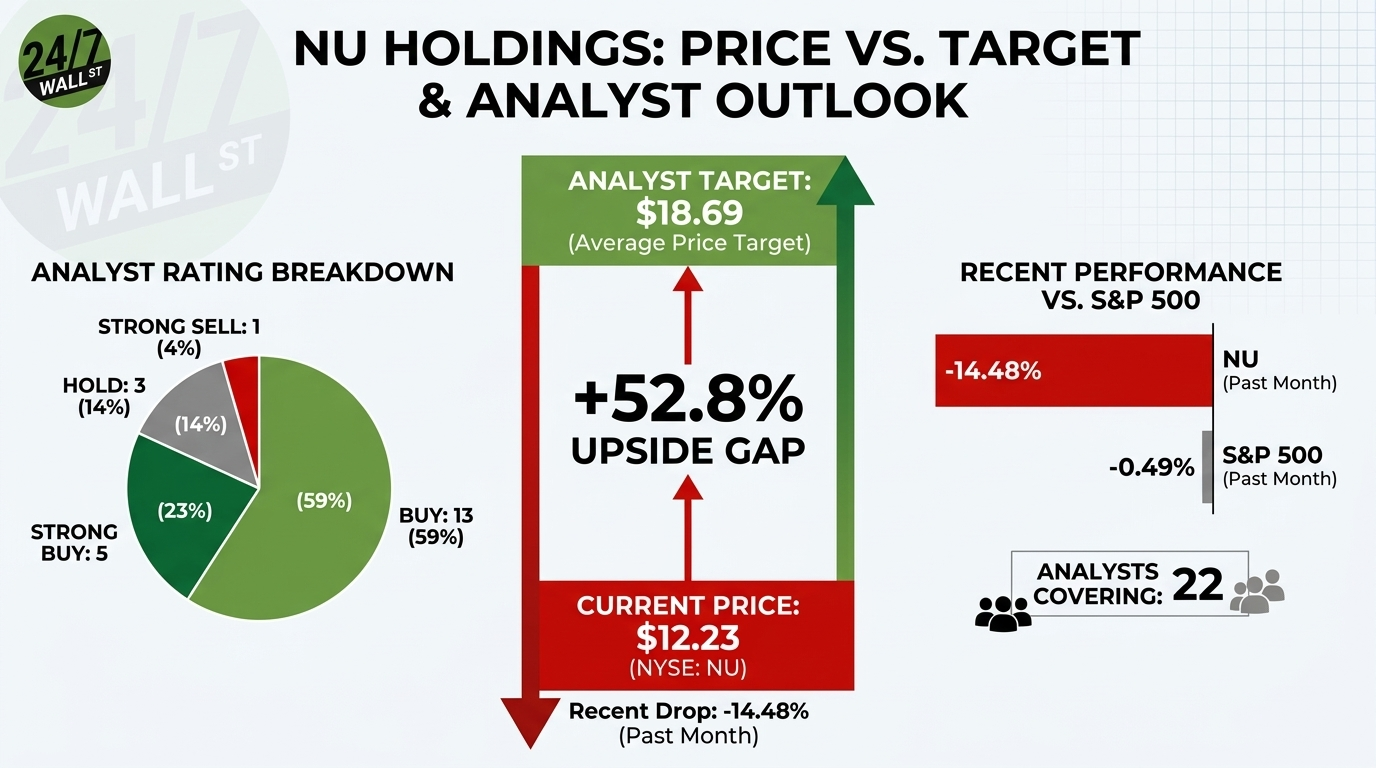
Goldman Sachs sees Nu Holdings doubling from here, yet the stock keeps sliding even as profits hit record highs. Understanding what separates those two realities could define whether this is the buying opportunity of the year or a value trap in disguise.
StoneCo (NASDAQ: STNE - Get Free Report) and International Money Express (NASDAQ: IMXI - Get Free Report) are both finance companies, but which is the superior business? We will compare the two companies based on the strength of their profitability, analyst recommendations, institutional ownership, risk, earnings, valuation and dividends. Valuation and Earnings This table compares StoneCo and
The company successfully pivoted to a profitable, focused MSMB financial services ecosystem. High NPL ratios in the credit portfolio remain a persistent operational risk factor.