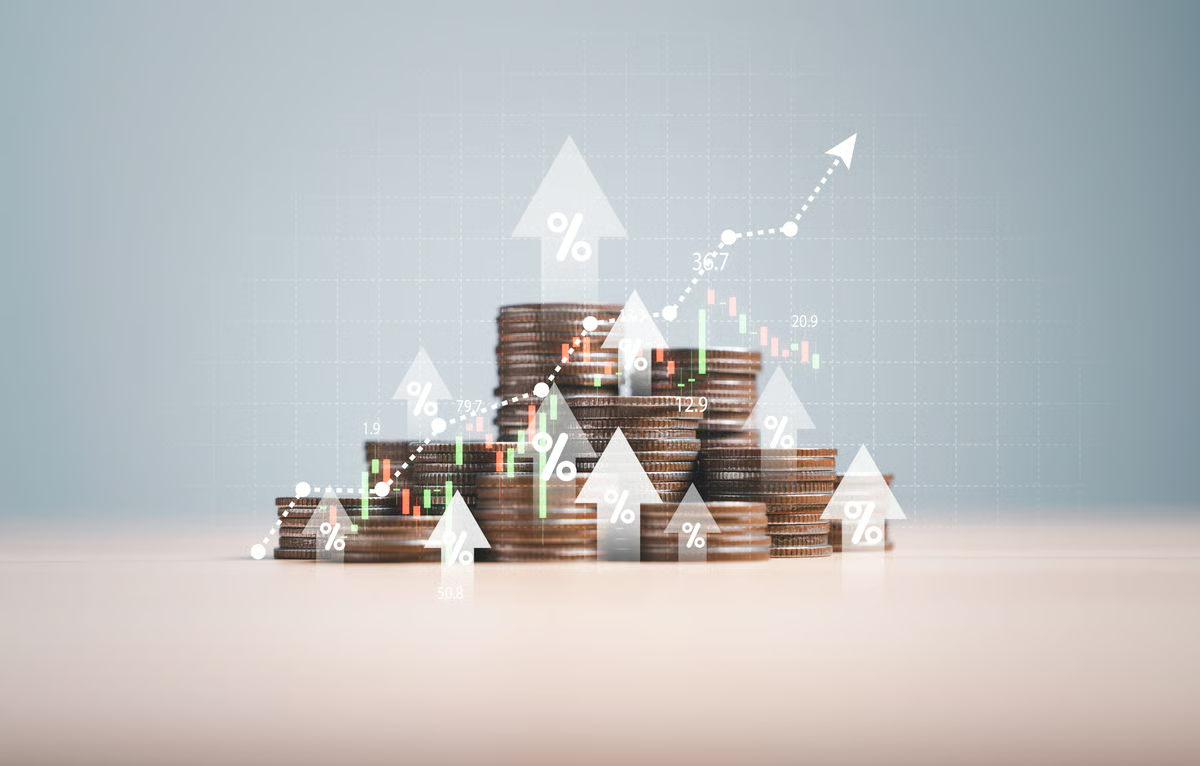
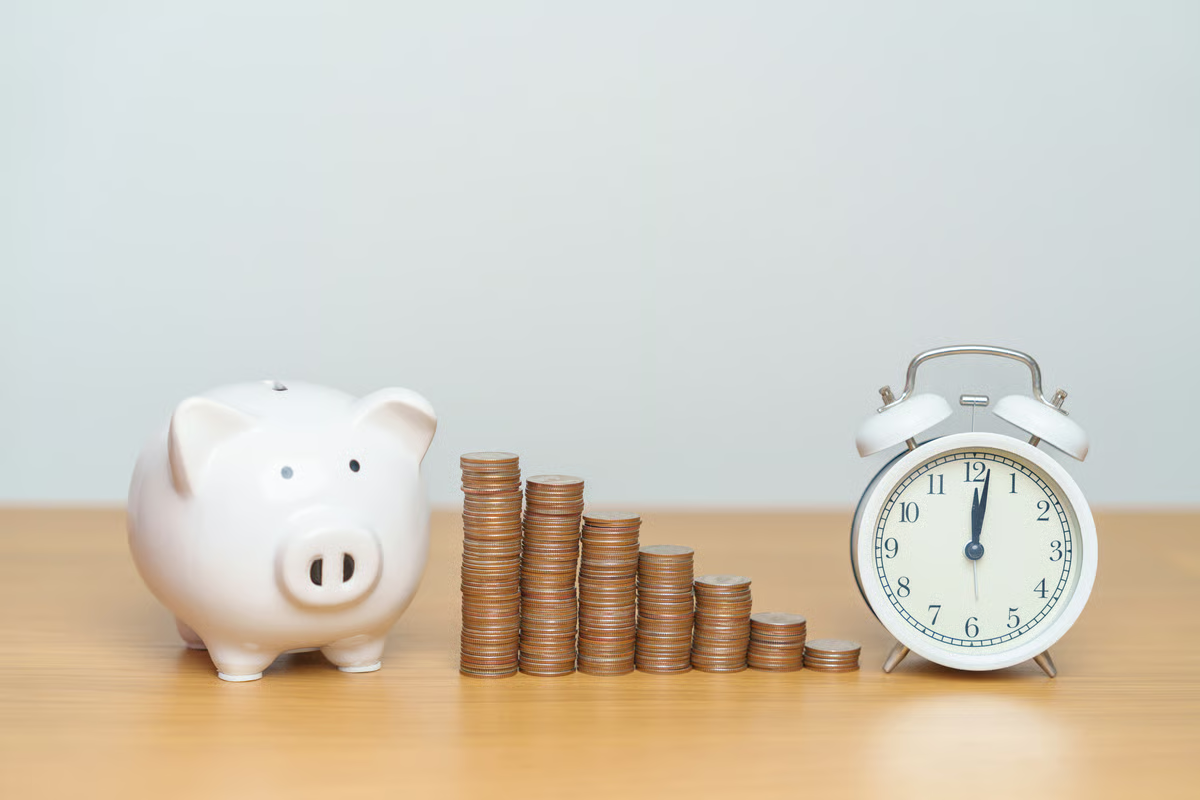
Die Grafik zeigt die prognostizierten Quartalsgewinne (Bereinigter Gewinn pro Aktie, EPS) und die tatsächlich erzielten Gewinne (grün: Analystenschätzungen übertroffen, rot: Analystenschätzungen verfehlt) für den ausgewählten Zeitraum.
Umsatz (USD)
Schätzung
Umsatz
Die Grafik zeigt die prognostizierten Quartalsumsätze und die tatsächlich erzielten Umsätze (grün: Analystenschätzungen übertroffen, rot: Analystenschätzungen verfehlt) für den ausgewählten Zeitraum.
Güte der Analystenschätzungen – EPS (aktueller Zeitraum)
Quartal / Datum
EPS (USD)
Schätzung (USD)
Abweichung
Quartal / Datum
Umsatz (Mrd USD)
Schätzung (Mrd USD)
Abweichung
Revisionen der Gewinnschätzungen
EPS-Schätzungen für die Geschäftsjahre
2026, 2027, 2028.
Consumer staples companies tend to generate resilient cash flows because their products and services remain in demand across all economic environments. The strength of Dividend Kings and long-term growers comes from structural advantages.
Coca-Cola and Walmart are both dividend kings, with 64 and 53 consecutive years of dividend increases, respectively. Coca-Cola has an asset-light business model that lets it operate with industry-leading margins.
Dividend-growth blue chips like Coca-Cola double income in nine years despite lower starting yields, while high-yield BDCs and REITs with frozen payouts risk delivering less income over a decade than lower-yield growers.
One boasts global scale and steady profits; the other surges ahead with rapid growth and bold partnerships. Explore how their financials and risks stack up.
The U.S. median household income sits near $80,610, and a $1.1 million dividend portfolio generating a blended 7% yield would produce roughly $77,000 a year in cash flow. That level of income exceeds the median household income in most of the country, which helps explain why geography can dramatically change the retirement equation. The same... A Dividend Portfolio That Beats the Median Household Income in 47 of the 50 States on $1.1 Million Invested
The SPDR S&P Dividend ETF (NYSEARCA:SDY) is doing exactly what a yield-tilted dividend fund is supposed to do while the broader market wobbles: grinding higher while the broad market wobbles. SDY trades near $146, up 4% year to date after the S&P 500 finished Q1 2026 in negative territory. Over the past year, SDY has... If Treasury Yields Jump Above 4.75%, Here's What Happens to SDY
Portfolios
0
Zum Anlegen oder Bearbeiten von Portfolios müssen Sie sich anmelden oder einen Account erstellen.
Aktuelle Aktie in ein Portfolio speichern oder neues Portfolio anlegen: